|
FISCAL FEDERALISM IN RUSSIA: RULES VERSUS ELECTORAL POLITICS* Vladimir Popov** ABSTRACT This paper examines the determinants of financial flows between the federal government and regional authorities in Russia. The main question is to what extent intergovernmental transfers correspond to the “ideal pattern” – equalization of the abilities of the regions to provide public goods – and to what extent, if at all, they reflect the influence of federal-regional political discourse (asymmetrical federalism). The main finding is that actual net transfers in 1996-98, although quite close to the “ideal patterns”, depended also on the results of the parliamentary and presidential elections of 1995-96 and on the relations of the regions with the federal center. The more votes cast for pro-central government parties in 1995 parliamentary elections and for Yeltsin in the 1996 presidential elections and the lower the tensions with Moscow after the elections, the more favorable was the fiscal balance for the region with the federal center. The result is very robust when using different measures of fiscal capacity (index of tax potential) and costs of providing public goods (budgetary expenditure adjustment index). JEL CLASSIFICATION: H7, P2, R5 KEYWORDS: FISCAL FEDERALISM IN RUSSIA * The financial support of CEPRA (http://www.online.ru/sp/cepra/) is gratefully acknowledged. I thank Joan DeBardeleben for helpful discussions and Katya Zhuravskaya for sharing data on indices of regional power and relations with the center. Usual disclaimers apply. **Institute of European and Russian Studies (EURUS), Carleton University, 1125 Colonel By Drive, Ottawa, Ontario KlS 5B6 CANADA Tel.: 613-520-2600 ext. 8480; Fax: 613-520-7501. E-mail: vpopov@ccs.carleton.ca
FISCAL FEDERALISM IN RUSSIA: RULES VERSUS ELECTORAL POLITICS 1. Review of the literature The emergence of the system of fiscal federalism in Russia in recent years was one of the most important reforms in the public sector that was carried out during transition. Not surprisingly, there is a rapidly growing literature on this subject. With some reservations, it can be divided into three broad categories. First are normative papers that seek to put Russian experience into the international context and to design a system of equalization payments that is most appropriate for Russian conditions (Batkibekov, Kadotchnikov, Lugovoy, Sinel’nikov, Trounin, 2000; Lavrov, 2000; Martinez and Boex, 1997a,b,c, 1999; Morozov, 1999; Kadotchnikov, Lougovoi , Trounin, 1999; Trounin, 1999). These papers have analyzed dramatic changes in intergovernmental financial relations in the 1990s and laid the foundations for the Russian model of fiscal federalism as it has emerged today (Minfin, 2001). Second, there are papers that examine the actual factors that affect intergovernmental transfers in the transition period (Freinkman and Haney, 1997; McAuley, 1997; Popov, 2001; Stewart, 1997; Tabata, 1998, 2000; Triesman, 1996, 1998a,b; Zhuravskaya, 2000). The main question discussed in these papers is to what extent actual transfers are really equalizing and to what extent they are used as an instrument of federal-regional politics (rewarding either pro-center governors or troublemakers). Third, there are studies of broader scope, mostly political science papers about the nature of Russian federalism that incorporate fiscal intergovernmental flows into a general model of center-regional relations (Petrov, 2000; Polishchuk, 1998; Solnick; Speckhard, 2000; Stoner-Weiss, 2000). These studies mainly seek to explain the decentralization of the Russian Federation that occurred during the 1990s and the behavior of regions and central authorities in the “bargaining federalism game”. This paper belongs to second steam of literature and seeks to identify economic and political factors affecting financial flows between the center and the regions in 1996-98. Whereas there is a near-consensus that the Russian system of fiscal federalism in the 1990s was far from being perfect, there seems to be little agreement between scholars on what the key determinants of intergovernmental financial flows have been. As documented by Triesman (1996 and 1998 a, b), direct financial transfers from the federal budget to the regions in 1992 and 1994 depended mostly on the lobbying power of the regions, which in turn was determined by their ability to threaten and create trouble for the federal government. Those regions that voted against Yeltsin in 1991 and against pro-Yeltsin Russia’s Choice bloc in December 1993, that issued early sovereignty declarations, and whose governors opposed Yeltsin publicly in his conflict with the parliament in September 1993, all seem to have received larger net transfers from the center in subsequent years. Lavrov (cited in Martinez and Boex, 1999) and Triesman (1996) claimed that 21 ethnic republics of the RF enjoyed financial preferences, such as the retention of a higher share of tax proceeds, larger subsidies from the center, and single channel tax collection regimes. Stoner-Weiss (2000), however, questions the ability of the weakened and disintegrating central government to act adroitly and resolutely. She also demonstrates that control by the center over fiscal flows was an imprecise and clumsy instrument in curbing many regional challenges to central state governing capacity. Freinkman and Haney (1997) have shown that federal transfers to the regions do matter in explaining national economy expenditures funded by Russian regions, especially in explaining housing subsidies, but they were careful not to claim that the neediest regions have received the most in transfers. Stewart (1997) and Hanson (2000) have argued that federal government transfers to the regions – contrary to what many analysts claimed - are roughly compatible with the regional needs because they go mostly to the neediest regions. They believe, however, these transfers are too small and too thinly spread to make a difference. Popov (2001) has shown that net intergovernmental financial transfers are largely of the “Robin Hood” type, i.e., going mostly from rich to poor regions, but they are more than counterweighted by private business transfers going in the opposite direction. Zhuravskaya (2000) provides evidence that in Russia, unlike in China, every time the municipalities are starting to earn greater revenues, the regional authorities tend to change rules about sharing taxes and providing transfers to municipalities in such a way as to appropriate these greater revenues for themselves. It is logical to expect that the federal government may exercise the same policy vis-à-vis the regions. Speckhard (2000) looked at the degree of the assertiveness of the particular regions, measured by their ability to gain privileges, including financial ones, from the center. He concluded that among other factors (size, economic potential, consolidation of the regional elite) the ability to deliver a majority vote for Yeltsin during 1996 presidential elections did provide particular regions with a bargaining chip in their relations with the center. Finally, as many authors have observed (for instance, Solnick, 1999; Stoner-Weiss, 2000; Petrov, 2000), the federal approach to the regions in general and to intergovernmental transfers in particular did not stay the same throughout the 1990s. Whereas in the first half of the decade, following famous Yeltsin’s appeal to the provinces – “take as much independence as you can swallow” – the balance of power in the Russian Federation shifted in favor of the regions, in the second half of the 1990s centralizing tendencies were evidently at play. Many observers considered Putin’s rise to power (1999 parliamentary and 2000 presidential elections) as victory of poor regions over wealthy ones. The latter were united into a Primakov-Luzhkov “Fatherland- All Russia” electoral bloc that did not do well in the elections. Whether the center succeeded in recent years in centralizing the Federation is an open question, but there is no doubt that the center has tried to take a tougher stand on the regional autonomy. In the next section I suggest possible explanations for the conflicting views found in the literature on intergovernmental transfers and formulate the hypothesis to be tested. Section 3 presents regression results that show that net financial transfers in 1996-98 were generally compatible with the equalization scheme, but were also used to reward the pro-center regions (i.e., those that voted for the pro-Moscow parties and for Yeltsin in the 1995-96 elections and that had less tension with the federal government). Finally, in section 4 some conclusions are drawn and the implications for the broader research on federalism are discussed. In particular, the relevant spin-off for the first stream of the literature on fiscal federalism is the identification of the loopholes in the current system that allow “bending the rules” so as to reward political allies. The implication for the third stream of literature is the comparison of the viability of two different models of asymmetrical federalism – the one that gives preferences to supporters and the other that is aimed at pacifying opponents.
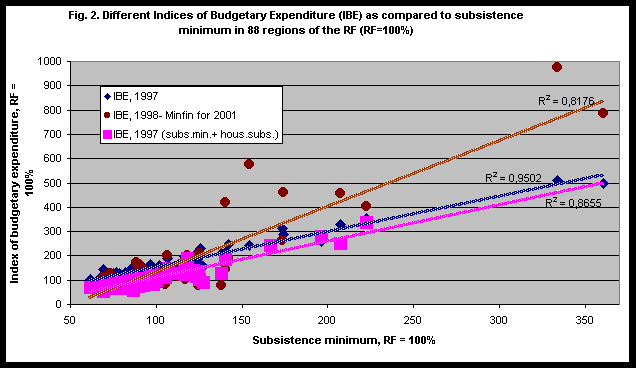
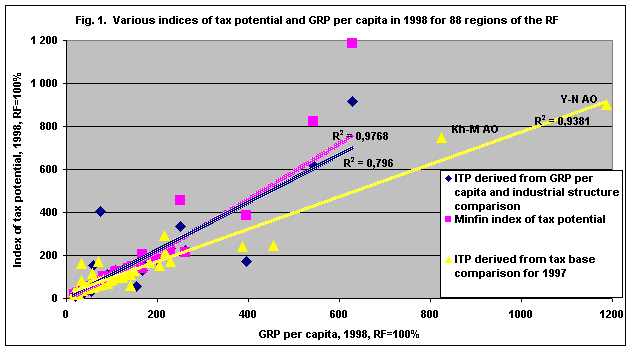
If political factors influence patterns of intergovernmental financial flows, do they favor loyal to the center regions or “anti-center” regions, namely those that are involved in conflicts with the federal government? The Triesman hypothesis is that in the first half of the 1990s Moscow pacified the troublemakers in pretty much the same way as Vienna appeased ethnic and regional claims within the Habsburg empire through tax concessions, new jobs, additional railway branch lines, and so on. But Triesman looked only at direct financial transfers from the center to the regions – payments from the federal budget to the regional budgets. These direct transfers, however, are only the visible part of the iceberg. The invisible part consists of tax revenues-sharing rules, which actually allow some regions to retain a greater than average portion of total revenues. However, the share of total tax revenues retained by the region (Triesman, 1996) cannot be an accurate measure of the benefits from fiscal federalism either. Some regions may pay a greater share of their total revenues to the center, but then can be compensated via the transfer flows in the opposite direction. To complicate things further, taxes are not necessarily paid in regions where output is produced: for instance, the share in regional and federal tax revenues received by resource rich regions (like Tumen) is about the same as their share in national GDP, whereas the share received by the city of Moscow is much higher (Tabata, 2000). Total net center-regional government financial flows should be calculated as the difference between the total revenues collected by all levels of government in the particular region and total outlays of regional and local authorities in this region. In this case the average region is certainly a donor vis-à-vis the federal government since federal taxes that are collected in the regions constitute the major source of revenues for the central government (although not the only source, since part of the revenues of the federal government, like custom duties and proceeds from privatization of federal property, are not disaggregated by regions). In 1996-98, in the period of financial stabilization, when prices were relatively stable, these annual net transfers from the regions to the center amounted to about 1000 rubles per capita (Predprinimatel’sky…, 1997; East West Institute, 1999), which was equivalent to about 8% of national GDP, or approximately equal to the average per capita income for 1.5 months (total revenues of the federal government amounted to 12% of GDP). The variations by regions, however, were huge: from over +7000R per capita in Moscow (national average per capita income for nearly 8 months) to -6000R per capita in Chukotka in the Far East (equivalent to nearly 7 monthly average per capita incomes). To put it differently, Moscow residents were paying “extras” to the federal budget equivalent to the average national per capita income for over half a year, whereas Chukotka residents were not paying anything to the central budget, but were receiving net transfers equivalent to average national income per capita for over 6 months. However, these net financial flows cannot be used without adjustment to measure the donor-recipient relationship between the federal government and the regions. Consider the same example of Moscow and Chukotka. Tax generating potential in Moscow is greater than in Chukotka because Moscow is wealthier and because industries that are located in Moscow generate more income. On the other hand, the cost of providing the standard basket of government services in Chukotka is higher than in Moscow – partly because the cost of living in Chukotka is higher and partly due to climatic and other conditions (for instance, more fuel is needed for heating schools, hospitals, etc.). Hence, both – total tax revenues collected in the region and expenditure of regional governments – have to be adjusted. This paper uses the notion of ideal transfers per capita (ITcap), which are calculated as the difference between all tax receipts (federal and regional) per capita in Russia on average (TAXREVcap) adjusted for the index of tax potential of the particular region (ITP) and average Russian expenditure of regional governments per capita (RGEXPcap) adjusted for the index of budgetary expenditure (IBE): ITcap = TAXREVcap * ITP – RGEXPcap * IBE Defined in such a way, ideal transfers are the difference between taxes that the region is able to collect, given the objective conditions in this particular region, the average Russian level of tax rates and tax compliance, and expenditure that the regional government should make in order to ensure the provision of the average Russian level of public services to local inhabitants. To put it differently, ideal transfers guarantee complete equalization: every region is asked to contribute to the federal budget in line with its tax potential and every regions gets enough funds to maintain public services at the average Russian level (i.e., if tax proceeds collected in the region are not enough, the region gets transfers from the center). The index of tax potential may be computed in various ways. One method is to take into account regional differences in gross regional product (GRP) per capita and in industrial structure (oil and gas industries generate more tax revenues than agriculture) – (see Batkibekov, Kadotchnikov, Lugovoy, Sinel’nikov, Trounin, 2000). Another method is to evaluate tax base in the region (value added for VAT, business profits for profit tax, personal income for personal income tax, alcohol and tobacco sales for excise taxes, etc.) and to multiply it by average national effective tax rate, i.e., the ratio of all tax proceeds to the tax base in the RF (Methodology, 2000). The first method is currently used by the Department of Finance of the RF to compute transfers to the regions from the Fund of Financial Support of the Regions (FFSR) – see (Minfin, 2001). Both methods yield results that are very consistent with the ranking of the regions by their GRP per capita (fig.1); the current methodology used by the Russian Ministry of Finance to calculate transfers from FFSR for the year 2001 uses the ITP, which is highly correlated with the GRP per capita ( R2= 98%). The index of budgetary expenditure (IBE) can also be computed in various ways. The most straightforward approach is to compare the cost of the basket of goods that represents the subsistence minimum, since it is assumed that regional differences in cost of provision of public goods are largely similar to regional variations in the cost of basic necessities. All other methods to compute the IBE necessarily take into account the cost of living index (subsistence minimum, cost of fuel, etc.), but also allow for other factors that may require higher/lower spending per capita by the regional governments aiming at providing public goods to the inhabitants of the region at a national average level. Such factors include climatic conditions, age structure of the population, the level of the development of infrastructure, share of urban population, etc. These factors affect all major categories of regional governments spending – from housing (housing is heavily subsidized from regional budgets and housing subsidies account for 20 to 50% of total regional government outlays) to education and health care, social assistance, public administration, and so forth. Fig. 2 shows results using three different measures of IBE; (a) the index of budgetary expenditure that takes into account only the cost of living and federal standard of housing subsidies (Kadotchnikov, Lougovoi, Trounin, 1999); (b) a measure of IBE which also accounts for the share of urban population and the average size of the residential communities, the age structure of the population, the share of unemployed and average income per capita (Methodology, 2000); and (c) the official IBE used for the purposes of distribution of FFSR (Minfin, 2001). Currently, the computation of this official IBE is quite cumbersome and involves adjustments for federal standard of housing subsidies per 1 square meter of living space, the cost of living, the share of the population living in Far North and Arctic regions, the share of the population below the poverty line, transportation accessibility, the age structure of population, and other less important factors. These indices are quite strongly correlated with the subsistence minimum, but the official (Minfin) IBE seems to increase proportionally more strongly with the rise of the subsistence minimum. To continue with the previous example of Moscow and Chukotka, for the calculation of the ideal transfers it is necessary to take into account that the tax potential (ITP) in both regions, which, for Moscow and Chukotka, is roughly 2 times higher than the Russian average, whereas the index of budgetary expenditure (IBE) for Moscow is around 1, and for Chukotka – from 4 to 8 (according to various calculations). That is to say, both Moscow and Chukotka have a capacity to generate two times more tax revenues per capita than Russia on average, but in Moscow one ruble of spending can deliver about the same amount of public goods as in RF on average, whereas in Chukotka the same amount of public goods can be purchased for 4-8 times as many. Table 1. Approximate Calculation of ideal transfers for 1997
*Actual net transfers from the region to the center per capita for the RF on average (1166 R) are not equal to ideal transfers (858 R) because ideal transfers are computed with the exception of non-tax revenues (part of these non-tax revenues, like revenues from the privatization of federal property, are not divided by the region of origin). The calculation of ideal transfers is shown in table 1. In 1997, both Moscow and Chukotka had a tax generating capacity of 7756 R per capita, but the maintenance of a national average standard for the provision of public goods required 3030R per capita in Moscow and 18180 in Chukotka. Hence, ideally Moscow was supposed to pay the federal budget 4726 R per capita (7756-3030), but in fact paid 8311 R, whereas Chukotka ideally was supposed to get 10424 R per capita (7756-18180) from the center, but in fact received only 7596 R. The difference, which can be conceived of as Moscow’s “overpayment” to the federal center (3555 R per capita) and Chukotka “under-financing” from the center (2828 R) – may or may not be related to political factors. In every federation there is a difference between actual and ideal net transfers, since complete equalization is normally not carried out and probably should not be carried out even from a purely theoretical point of view. The inability of particular regions to provide the national average level of public services may be the result of poor infrastructure. In this case the federal government can try to stimulate the development of the regional infrastructure through shared projects (with the regional government) rather than compensating infrastructure inadequacies through non-conditional equalization payments. However, the point of this paper is to test whether the difference between actual and ideal net transfers is influenced by political factors, in particular by center-regional relations. The hypothesis is that in 1996-98 pro-Moscow oriented regions were paying less to the center (i.e., getting from the center more) than they should.
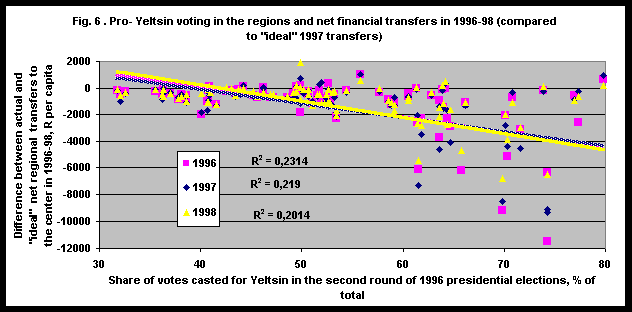
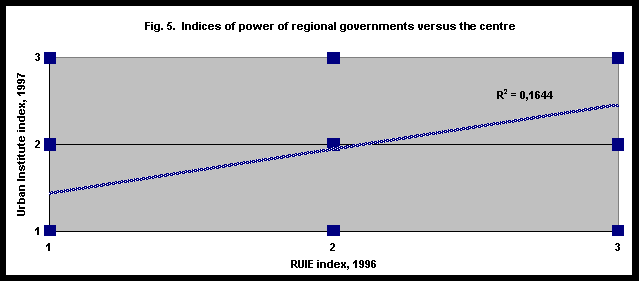
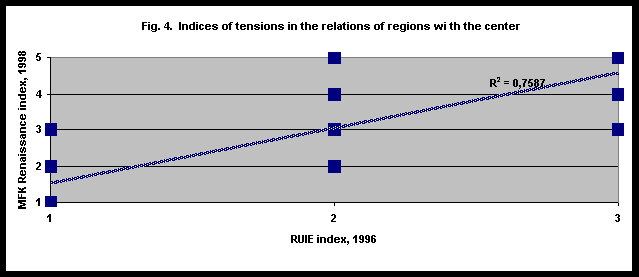
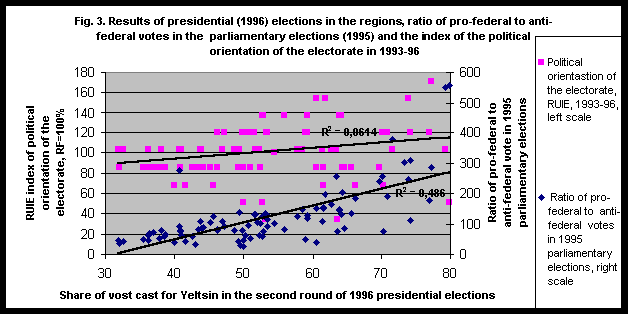
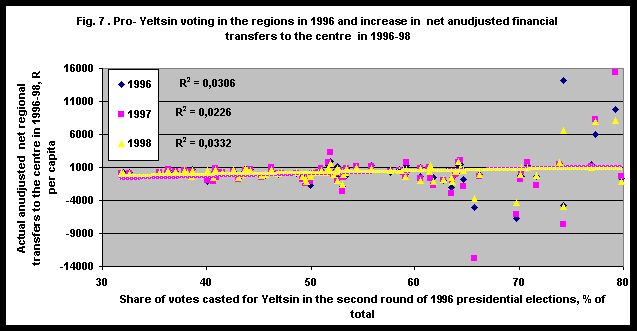
Pro- or anti-Moscow position of the particular regions can be measured by several indicators. The most straightforward measure is the share of the votes cast for Yeltsin in the second round of 1996 presidential elections. This share is strongly correlated with the results of December 1995 parliamentary elections as measured by the ratio of votes cast for pro-government parties (democratic and LDPR) to votes for leftist parties (fig.3). There is also an index of the political orientation of the electorate computed by the Russian Union of Industrialists and Entrepreneurs (RUIE) based on the voting preferences adjusted for the stability of these preferences (Predprinimatel’sky…, 1997) – by this measure RF average is equal to 100%; higher values represent more liberal (pro-reform) oriented voting patterns. Values on this measure are weakly correlated with the previous two indicators (fig.3). In addition, there are indices of tensions in the relationship between the regions and the center. Two of these indices are presented on fig. 4, where higher values represent greater tensions. One index comes from RUIE (Predprinimatel’sky…, 1997). The other index is constructed by MFK Renaissance (Ponomareva, Zhuravskaya, 2000) and takes account of the frequency of public statements by the governor against the policies of the center, the extent to which regional laws and regulations violate federal laws, the level of support of the governor by the center at the last elections, and the existence of a bilateral treaty between the region and the center. These two indices of tensions are strongly correlated (fig.4). Next, there are indices for measuring the power of regional administrations, where higher values represent more bargaining power with the center. One was computed by RUIE based on the average of estimates provided by experts estimates (Predprinimatel’sky…, 1997). The other is provided by the Urban Institute based on the analysis of regional legislation and its violations of federal laws, federal elections results (pro- or against the center policies), the regional natural resource endowment and other relevant information (Ponomareva, Zhuravskaya, 2000). Once again, the two indices are positively correlated (fig. 5), although not as strongly as the indices of tensions with the center. Finally, there are dummy variables that were used for the regression analysis, such as a capital city dummy (Moscow), AO dummy (for 11 autonomous regions – oblast’and okrug) and republic dummy (for 21 regions that are called republics). Formally, according to 1993 Constitution, all 89 regions of the RF have equal rights, but it may be that the remnants of the Soviet past (when the rights of republics, AOs and oblast’s were different) still play a role in fiscal federalism. The general result of comparing actual transfers with ideal transfers is that the difference between them is negatively correlated with pro-Yeltsin and pro-federal government voting in the regions, negatively correlated with the power of the regional administration and positively correlated with tensions between the region and the center. To put it differently, three political factors allowed the regions to reduce their transfers to the center in 1996-98: (a) voting in support of Yeltsin in 1996 presidential elections and in support of pro-Moscow parties in 1995 parliamentary elections, (b) greater bargaining power in relations with the center, and (c) lower tensions with the federal center. Pro-Moscow voting patterns and good relations with Moscow led to pecuniary benefits – they materialized into tangible monetary remuneration in the form of lower net transfers to the center or higher net transfers from the center as compared to “ideal” amounts (computed with the assumption of complete equalization). This result is very robust using various measures of fiscal capacity (ITP) and costs of provision of public goods (IBE), with one exception discussed later. The negative relationship between pro-Yeltsin voting patterns and transfers from the regions to the center can be observed in fig. 6: in every year - 1996, 1997 and 1998 – regions that supported Yeltsin in the 1996 presidential elections paid less than they should to the center or received more than they were entitled to from the center. It is noteworthy that there is virtually no relationship between actual (unadjusted) transfers and pro-Yeltsin voting (fig. 7). The regression results are reported in table 2. Consider first regression equations 1 to 7. Actual transfers in 1998 depend positively and significantly on ideal transfers, and negatively and significantly on pro-Yeltsin vote in 1996 presidential elections even when the capital city effect (Moscow pays relatively more to the federal budget) and autonomous regions effect (AOs pay relatively less to the federal budget) are controlled for. Each additional percentage point of votes for Yeltsin in the second round of 1996 presidential elections was associated with 15 to 22 R per capita in lower transfer from the region to the center. Indices of tensions in relations with the center and indices of regional power had the predicted signs, but sometimes were not very significant (at 11-17% level) and, what is more important, did not improve the goodness of fit, even though the size of the sample in this case decreased from 88 to 80 regions. All these results hold for the 1996 and 1997 transfers. They also hold when the pro-Moscow vote in the 1995 parliamentary elections is used instead of the outcomes of 1996 presidential elections (results not shown). The results are very robust to using various measures of ideal transfers: these ideal transfers were calculated with various combinations of all available ITP and IBE indices and in all cases, with only one exception discussed later, the relationship between the variables was basically the same. Even when ideal transfers were computed in the “Canadian way”, i.e. without making adjustments for different costs of provision of public goods, the relationship was basically the same. Also not shown in table 2, is the relationship between the Table 2. Regression of actual net financial transfers from regions to the center in 1996-98 ideal transfers, election results and political tensions variables (T-statistics in brackets, all coefficients significant at 10% level except those marked with asterisks) Dependent variable – net financial transfers from regions to the center in 1998
*Significant at 17% level or less. **Significant at 29-62% level. change in actual net transfers in 1997 and 1998 as compared to 1996: regions that voted for Yeltsin in 1996 were rewarded in 1997-98 by being allowed to contribute less to the federal budget. The transfer burden was also shifted away from the rich AOs with high tax potential, but these AOs voted mostly for Yeltsin anyway. Consider now equations 8 and 9, which show the exceptional case mentioned above. Here ideal transfers are computed with the official IBE used for the calculation of transfers in the 2001 RF budget. The results are markedly different: R2 increases from 68-76% in previous regressions to 89-91%. The significance of coefficients for ideal transfers, Moscow dummy, tensions with the center and power vis-à-vis the center improves, but the coefficients of the pro-Yeltsin vote variable become statistically insignificant. The latter coefficients still have the predicted sign (more votes for Yeltsin – less transfers to the center), but the level of the coefficient is very low: only 3 to 6 R per capita as compared to 15 to 22 R per capita in previous regressions. It is quite obvious that the ideal transfers computed with the official IBE are much closer to the actual transfers in 1996-98 than the ideal transfers computed with all other combinations of ITP and IBE, including official ITP for 2001 budget. It is easy to see this relationship from table 3, which reports the correlation coefficients for actual and ideal transfers calculated using various measures: if ideal transfers are computed with official IBE for 2001 RF budget (Minfin, 2001), they are noticeably more strongly correlated with the actual transfers in 1996-98. As was already mentioned, the official IBE is computed with the greatest number of adjustments – not only for the cost of living, but also for housing subsidies, share of the population living in Far North and Arctic regions, share of the population below the poverty line, transportation accessibility, age structure of population, and other factors. Unfortunately, due to the lack of data, it is impossible to determine precisely what explains the difference between the official IBE and other measures of adjustment of budgetary spending. But it is possible to show that both – ideal transfers computed with official ITP and IBE, and the difference between official and unofficial IBE - are correlated with the actual pattern of transfers in 1996-96 and with the share of votes cast for Yeltsin in 1996. That is to say, the official IBE incorporated the influence of political factors that alter federal-regional financial flows, so it is by no means surprising that ideal official transfers (computed with official IBE) are no longer correlated with political factors. To cite one example, in all 7 regions where official IBE was over 400% of the RF average (Nenetsky AO, Taimyrsky AO, Evenkiysky AO, Sakha Republic, Chukotsky AO, Koryaksky AO, and Magadan oblast’ – see fig. 2) the share of votes given to Yeltsin in the second round of 1996 presidential elections was higher than the national average, 62 to 74% against 54%. True, these are all Northern, Siberian and Far East regions with the high cost of living. But the other “expensive” regions (many of them are immediate neighbors of highest official IBE regions, but with less impressive pro-Yeltsin voting records) were assigned substantially lower official IBEs. Table 3. Correlation between actual net transfers from regions to the center in 1996-98 and different measures of ideal transfers
Table 4 summarizes the regression results for the variables explaining official ideal transfers and official IBE. It turns out that official ideal transfers (equations 1-3), after controlling for hypothetical ideal transfers computed with simple ITP and IBE, depend positively on the actual pattern of transfers in 1998 and negatively on the pro-Yeltsin vote, Moscow and AO dummies. In other words, official transfers for the 2001 budget were computed in such a way that they benefited Moscow, AOs and regions that voted for Yeltsin - those regions were required to pay less to the center. On the other hand, the newly computed official transfers disfavored regions that were paying a lot to the center previously, i.e. they were brought more in line with actual patterns of transfers in 1998. Table 4. Regression of ideal transfers computed with official ITP and IBE and of official IBE on actual patterns of transfers in 1998 and on voting patterns (T-statistics in brackets, all coefficients significant at 10% level except those marked with asterisks) Dependent variables: - Equations 1-3 – ideal transfers computed with official ITP and IBE
This effect of the “streamlining” of the official transfers to bring them closer to the actual patterns of financial flows that existed previously and to make sure they are favorable for political supporters is due mostly to the newly computed IBEs, since newly computed ITPs remained quite in line with the objective measures of tax capacity. In fact, as equation 4 suggests, the difference between the officially computed IBE and the IBE based on the cost of subsistence minimum depends positively on pro-Yeltsin vote, Moscow and AO dummies and negatively – on the actual transfers in 1998. That is, Moscow, AOs and pro-Yeltsin voting regions were assigned higher IBE (to make sure they could leave more tax revenues in the region for the financing of their own regional spending and to transfer less funds to the center). On the contrary, the more a region was paying to the center before, in 1998, the lower the IBE was established for this region, presumably to make sure the region continued to pay as much as it had previously. To summarize, there is a clear evidence that the actual pattern of net financial transfers between the regions and the center in 1996-96 was only partly determined by objective indicators of tax capacity and costs of providing public goods. Controlling for these objective indicators, it turns out that fiscal flows were favoring AOs, regions voting in a pro-center way, regions with more bargaining power and with less tensions with the center. It also appears that the indices of budgetary expenditure for the 2001 RF budget were computed in such a way as to incorporate these actual patterns of transfers, i.e. to make sure that there is no need to alter the existing pattern of financial flows drastically.
The main point of the paper was to identify the bias in the Russian style fiscal federalism. The previous research provided evidence that there is no major bias (i.e. Russian fiscal federalism is symmetrical) or that there is a bias in favor of regions that oppose the federal center, i.e. the federal government is pacifying the troublemakers. This paper contains evidence to the contrary: rather than appeasing the opponents, the federal center seems to punish them financially. Regions that voted for leaders and parties that challenged the federal government and that had more tensions with Moscow tended to get less funds from the center in 1996-98. Why do these conclusions differ from those reached in other studies? For one thing, they are based on examining total net financial flows between the regions and the center, not only particular elements of these flows, like transfers from the federal budget to the regions or the share of total tax revenues retained by the region. The other reason is that net financial flows are adjusted for the objective regional differences in tax generating capacity and in costs of providing public services. These conclusions hold for the period from 1996 to 1998 and it is yet to be tested whether similar patterns existed in the earlier and in the later periods. The previous period, especially 1992-94 is generally believed to be the period of decentralization and it may well be that the trouble-making regions were treated at that time in an appeasing rather than in an oppressive way. It is remarkable, however, that the oppressive pattern of dealing with “anti-center” regions existed as early as in 1996-98, before the centralization drive that was initiated in 2000 by President Putin. It is also of interest that the calculation of official transfers for 2001 federal budget was carried out in such a way that the existing pattern of transfers was institutionalized: the official indices of budgetary spending (used to account for the uneven budgetary requirements of the regions) absorbed a considerable portion of variations in transfers caused by political factors. There are at least two implications for future research on fiscal federalism and for the literature on the issue. First, it is quite understandable that it is impossible to change the existing asymmetrical pattern of financial flows overnight because of the political interests involved. The gradual approach to symmetry may be the only feasible solution. However, the adjustment of the coefficients used in the calculation of transfers in such a way as to make the asymmetrical arrangements look symmetrical is probably the worst possible scenario, since in this case the mechanisms of fiscal federalism become non-transparent and misleading. The simplification of the current transfer calculation scheme, especially of the computation of IBEs, even though it may lead to the large discrepancies between actual and ideal transfers, is definitely a preferable solution. Second, Russian fiscal federalism presents a challenge for the theoretical research. The asymmetries of Russian federalism are of a different type as compared to Austro-Hungary. Whereas in the latter the center was retreating, giving more funds and rights to the opposing provinces, in Russia the center is advancing, punishing the opponents and rewarding the supporters. Contrary to the gentlemen-type “balance of power” and “art of possible” center-regional diplomacy of the Habsburg empire, the Russian federal government of the late 1990s was suppressing the opposing regions with the iron fist without the velvet glove. If asymmetrical federalism (skewed in favor of benefiting regions that support the center) is regarded as an unstable equilibrium, it is conceivable that it could evolve into one of the three types of more stable equilibrium: (1) authoritarian symmetrical federalism resulting from the success of the center in undermining opposing regional governments (once the central government has ousted trouble-making authorities in the regions and replaced them with more loyal administrations, it stops their underfinancing); (2) democratic symmetrical federalism resulting from the abandonment by the center of the preferential policies towards particular regions; (3) loosening of the federation up to the point of the break up resulting from the inability of the center to impose its will on the opposing regions. The question, of course, is under which particular conditions each of the three outcomes becomes more or less probable. REFERENCES Batkibekov, S. Kadotchnikov, P., Lugovoy, O., Sinel’nikov, S., Trounin, I. (2000). Evaluation of the Tax Potential of the Regions and Distribution of Financial Assistance from the Federal Budget. – In: “Perfection of Interbudgetary Relations in Russia”. Moscow, 2000, IET, WP ¹ 24 – in Russian (http://www.iet.ru/papers/papers_r.htm). East West Institute (1999). Russia: Federal Budget and the Regions--Analysis of Fiscal Flows. Moscow, 1999 (in Russian). Freinkman, L., Haney M. (1997) What Affects the Propensity to Subsidize: Determinants of Budget Subsidies and Transfers Financed by the Russian Regional Governments in 1992-1995. The World Bank, WP #1818 (). Goskomstat (various years). Russian Statistical Yearbook. Moscow, Goskomstat (in Russian). Hanson, Ph. (2000). Understanding regional Patterns of Economic Change in Post-Communist Russia. In: Murakami, T., Tabata, S., eds. Russian Regions: Economic Growth and Environment. Slavic Research Center, Hokkaido University, Sapporo, Japan, 2000. Kadotchnikov P., Lougovoi O., Trounin, I., (1999). Evaluation of Regional Differences of the Needed Budgetary Expenditure of the Subjects of the Russian Federation. IET working paper (http://www.iet.ru/papers/papers_r.htm). Lavrov, A. (2000). The Strategy and Tactics of the Reform of Interbudgetary Relations in Russian Federation. – In: “Perfection of Interbudgetary Relations in Russia”. Moscow, 2000 IET, WP ¹ 24 – in Russian (http://www.iet.ru/papers/papers_r.htm) Martinez J. and Boex J. (1997a). An Analysis of Alternative Measures of Fiscal Capacity for Regions of the Russian Federation. Georgia State University. ISP Working Paper Number 97-4. June 1997. Martinez J. and Boex J. (1997b).Fiscal Capacity: An Overview of Concepts and Measurements Issues and Their Applicability in the Russian Federation June 1997. Georgia State Univesity. ISP Working Paper Number 97-3. Martinez
J. and Boex J. (1997c). A Methodological Note on the
Reform of Equalization Transfers in the Russian Federation.
June 1997. Georgia State University. ISP Working Paper
Number 97-2. McAuley A. (1997). The Determinants of Russian Federal-Regional Fiscal Relations: Equity or Political Influence. - Europe-Asia Studies 49, (3): 431-444. Methodology …(2000). Methodology of the Distribution of Payments from the Fund of the Financial Support of the Regions of the Russian Federation for the Year 2000. – Unpublished manuscript, in Russian. Minfin (2001). Methodology of the Distribution of Payments from the Fund of the Financial Support of the Regions of the Russian Federation for the Year 2001- in Russian (http://www.minfin.ru/fvr/ffpr.htm). Morozov, A. (1999). Intergovernmental Transfers Reform in the Russian Federation. Fiscal Policy Note. February 8, 1999, Moscow World Bank Office. Petrov, N. (2000). Federalism Russian Style. – Pro et Contra, Vol. 5, No.1 (in Russian). Polishchuk, L. (1998). Russian model of “bargaining federalism” (political-economic analysis). – Voprosy Ekonomiky, 1998, No.6, pp. 68-86 (in Russian). Ponomareva, M., Zhuravskaya K. (2000). Federal Tax Arrears: Liquidity Problems, Federal Subsidies, or Regional Protection? CEFIR and CEPR (http://www.cefir.org/Papers.html). Popov, V. (2001). Reform Strategies and Economic Performance of Russia’s Regions. – World Development, May, 2001. Predprinimatel’sky… (1997). Business Climate in Russia’s Regions. Geography of Russia for Investors and Entrepreneurs. Nachala Press, Moscow, 1997 (in Russian). Regiony… (1997). Regions of Russia. Zhurnal Expert, Moscow, 1997 (in Russian). Russia… (1998). Russia: Regional Risk Rating. Institute for Advanced Studies, Vienna, 1998. Sinelnikov S., Trounin, I., Lougovoi O. (1999). Evaluation of the Tax Potential of the Subjects of Federation and the Development of the Methodology of the Distribution of the Fund for the Financial Support of the Regions for the Year 2000. IET working paper (http://www.iet.ru/papers/papers_r.htm). Sinelnikov S., Kadotchnikov P., Shkrebela E., Trounin I. (2001). "Impact of Intergovernmental Grants on the Fiscal Behavior of Regional Authorities in Russia", mimeo, IET, 2001. Solnick, S. (1999). Methods of Central Control Over Russia's Provinces, and Prospects for the Future. - PONARS Policy Memo No. 97 (http://www.fas.harvard.edu/~ponars/POLICY%20MEMOS/Solnick97.html). Speckhard, C. (2000). The Political Economy of Institutional Asymmetry in the Russian Federation, 1990-1998. University of Texas in Austin. 2000. Unpublished paper. Stewart, K. (1997). Are Intergovernmental Transfers in Russia Equalizing? EUI Working paper No. 97/22. Stoner-Weiss, K. (2000). Wither the State? The Regional Sources of Russia’s post-Soviet Governance Crisis. Center of International Studies, Princeton University. Unpublished paper (http://www.wws.princeton.edu/~cis/stoner-weiss.pdf). Tabata, S. (1998). Transfers from Federal to the Regional Budgets in Russia: A Statistical Analysis. – Post-Soviet Geography and Economics, 1998, 39 (8), pp.447-60. Tabata, S. (2000). Distribution of Oil and Gas Export Earnings among Russian Regions. A Preliminary Analysis. Hokkaido University, 2000. Unpublished paper. Treisman, D. (1996). The Politics of Intergovernmental Transfers in Post-Soviet Russia. - British Journal of Political Science 26, July, 299-335. Treisman, D. (1998a). ”Fiscal Redistribution in a Fragile Federation: Moscow and the Regions in 1994.” British Journal of Political Science 28, 185-222. Treisman, D. (1998b). “Dechiphering Russia’s Federal Finance: Fiscal Appeasement in 1995 and 1996.” Europe-Asia Studies 50 (5): 893-906. Trounin, I. (1999). Interbudgetary Transfers in the Russian Federation. IET working paper (http://www.iet.ru/papers/papers_r.htm ). Zhuravskaya, K. (2000). Incentives to provide local public goods: fiscal federalism, Russian style, Journal of Public Economics (76)3 (2000), pp. 337-368. |

